-
Bahasa Indonesia
-
English
Oleh: Vincent Gaspersz, Lean Six Sigma Master Black Belt Certified Management System Lead Specialist and Auditor
- American Production and Inventory Control Society (www.apics.org) Certified in Production and Inventory Management (CPIM), Certified Fellow in Production and Inventory Management (CFPIM) and Certified Supply Chain Professional (CSCP);
- American Society for Quality (www.asq.org) Certified Manager of Quality/Organizational Excellence (CMQ/OE), Certified Quality Engineer (CQE), Certified Quality Auditor (CQA), Certified Quality Improvement Associate (CQIA), and Certified Six Sigma Black Belt;
- International Quality Federation (www.iqf.org) Certified Six Sigma Master Black Belt (CSSMBB);
- Registration Accreditation Board (www.exemplarglobal.org) Certified Management System Auditor (CMSA), Certified Management System Practitioneer (CMSP), Certified Management System Specialist (CMSS), and Certified Management System Lead Specialist (CMSLS).
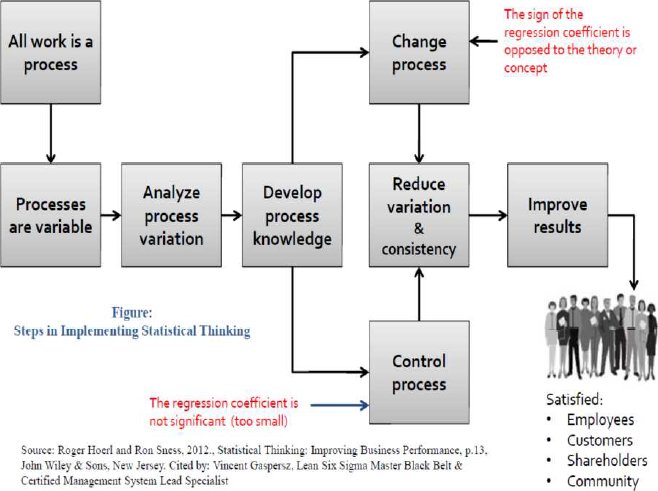
Divisi Statistika dari The American Society for Quality (ASQ Statistics Division) mengemukakan tiga prinsip utama yang bersifat filosofi yang sangat mendasar tentang Statistical Thinking, yaitu:
- Semua pekerjaan terjadi dalam proses-proses yang saling berhubungan di dalam sistem.
- Variasi selalu ada di semua proses di dalam sistem
- Kunci SUCCESS adalah memahami proses dan mengurangi variasi di semua proses agar mencapai nilai TARGET yang diinginkan di dalam sistem.
Ketiga prinsip dasar dari Statistical Thinking di atas dapat ditunjukkan melalui Bagan 1 terlampir di atas.
Dalam dunia nyata, praktek Statistical Thinking menuju target berupa reduksi variasi akan meningkatkan kepuasan pelanggan dan hal ini dapat ditunjukkan melalui fungsi kerugian Taguchi yang memberikan konsep yang mendukung ide-ide bahwa reduksi variasi menuju target akan meningkatkan nilai bagi pelanggan dan mengurangi biaya. Fungsi kerugian Taguchi yang berbentuk kuadrati L(x) = k(x – m)^2, di mana x adalah unit yang menyimpang dari nilai target, m adalah nilai target, dan k adalah koefisien kerugian, ditunjukkan dalam Bagan 2 terlampir.

Menggunakan tiga prinsip dasar dari Statistical Thinking di atas, maka Lynn D. Torbeck (2011, p.94-95)) dalam Journal of Pharmaceutical Technology mengembangkan Statistical Thinking menjadi 10 konsep dasar berikut:
- Pekerjaan terjadi di dalam proses maupun sub-proses yang saling terkait satu sama lain, dikenal dengan nama model SIPOC (Suppliers-Inputs-Processes-Outputs-Customers).
- Setiap proses memiliki pemasok (supplier) yang memberikan masukan (input) ke dalam aktivitas proses. Hasil dari setiap proses merupakan keluaran (output) yang akan diteruskan kepada pelanggan (customer), baik pelanggan internal (internal customer) maupun pelanggan eksternal (external customer).
Catatan: pelanggan internal adalah orang atau bagian/departemen/divisi di dalam organisasi yang menerima output dari proses, sedangkan pelanggan eksternal adalah orang atau bagian/departemen/divisi di luar organisasi yang menerima output dari proses. Output dari suatu proses dapat berbentuk hasil akhir atau hasil antara yang masih harus diproses lebih lanjut.
- Setiap proses dapat dipetakan menggunakan diagram alir (flow charts) atau alat lainnya, dipelajari secara sistematik, dipahami, dan ditingkatkan. Bagaimanapun, melakukan optimasi pada setiap langkah proses secara terpisah dapat menghasilkan proses menjadi tidak optimum secara global, dalam arti bisa terjadi sub-optimum.
- Pekerjaan dilakukan oleh kelompok orang yang memiliki perbedaan dalam latar belakang pendidikan, keterampilan, keahlian, kebutuhan, dan ekspektasi.
- Output dari setiap proses bervariasi sebagai hasil bersama dari penyebab-penyebab khusus atau sistematik (special or systematic causes of variation) dan penyebab-penyebab umum atau acak (common or random causes of variation). Penyebab-penyebab variasi ini dapat ditemukan, dipelajari, dan dipahami.
Catatan: team kerja yang tidak berfungsi secara efektif merupakan sumber variasi di dalam sistem (common or random causes of variation).
- Hubungan sebab-akibat merupakan landasan dari ilmu pengetahuan. Hubungan sebab-akibat ini dapat ditemukan, dipelajari, dikuantifikasikan, dan dipahami.
- Variabilitas adalah musuh bagi praktek manajemen organisasi yang baik, validasi, kualitas, produktivitas, efisiensi, dan keuntungan (profits). Variabilitas dapat diukur, dipelajari, dan dipahami.
- Statistika adalah ilmu pengetahuan tentang variasi.
- Variabilitas dalam proses dapat dikurangi TETAPI tidak dapat dihilangkan. Kita perlu mengadopsi filosofi menuju TARGET dan bekerja untuk KONSISTENSI.
- Setiap organisasi mencapai SUCCESS melalui perbaikan terus-menerus (continuous improvement) melibatkan kerja sama team (team work) untuk mengurangi variasi dan membawa proses ke dalam stabilitas secara statistikal (statistical stability).
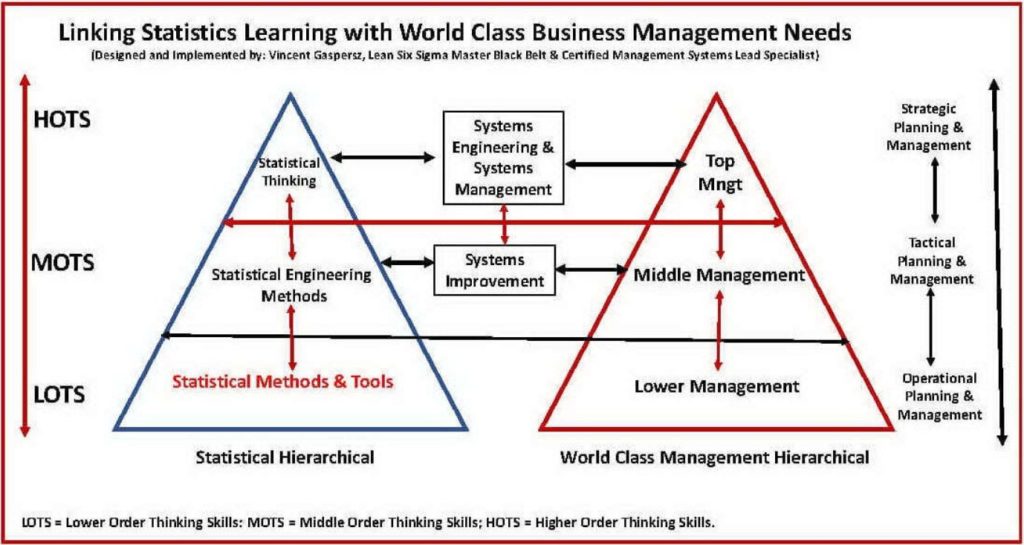
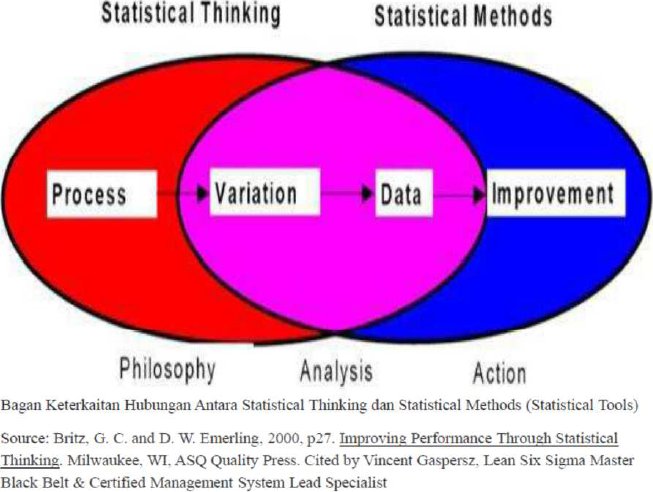
Melalui mengaitkan STATISTIKA dengan masalah-masalah dalam dunia nyata menggunakan 10 KONSEP sebagai pengembangan dari Statistical Thinking, maka pemikiran statistikal (Statistical Thinking) dapat mencapai integrasi dari manajemen, solusi masalah dalam dunia nyata, dan teknik-teknik statistika. Keterkaitan Statistical Thinking dan Statistical Methods (Statistical Tools) dapat ditunjukkan dalam Bagan 3 terlampir.
Apa itu Systems Thinking?
Sebelum membahas tentang systems thinking beserta aplikasi dalam dunia nyata, maka perlu dipahami beberapa terminologi tentang systems thinking yang telah diterima oleh masyarakat profesional secara internasional.
- System Thinking adalah suatu disiplin untuk melihat sesuatu secara keseluruhan (holistik) bukan secara parsial, yang bertujuan untuk mempelajari pola perubahan (dinamika) bukan statis, serta untuk memahami kesaling-terkaitan di antara banyak elemen (pola hubungan) dalam sistem yang didefinisikan. Di dunia nyata segala sesuatu yang saling berkaitan akan membentuk system, misalnya: sistem pendidikan, sistem pertanian, sistem pemerintahan, sistem sosial, sistem bisnis, dll.
- Systematic Thinking adalah cara berpikir menggunakan metodologi (metode-metode) tertentu. Misalnya seorang Lean Six Sigma Master Black Belt/Black Belt/Green Belt/Yellow Belt akan menggunakan metodologi DMAIC (Define, Measure, Analyze, Improve, Control) atau PDCA (Plan, Do, Check, Act) ketika melakukan perbaikan proses-proses dalam system. Atau menggunakan DMADV (Define, Measure, Analyze, Design, Verify) atau metodologi Design Thinking ketika melakukan desain proses-proses dalam sistem yang baru atau sistem yang telah ada.
- Systemic Thinking adalah cara berpikir menggunakan kombinasi analitikal (berdasarkan analisis) dan sintesis.
Catatan: analisis dan sintesis merupakan higher order thinking berdasarkan taksonomi Bloom.
Beberapa cara untuk memikirkan dan menentukan sistem adalah berkaitan dengan kriteria berikut:
- sistem memiliki tujuan (objective)
- sistem terdiri dari elemen-elemen,
- semua elemen dari sistem harus berhubungan (langsung atau tidak langsung),
- sistem memiliki batas,
- batas sistem adalah keputusan yang dibuat oleh seseorang atau sekelompok orang,
- sistem dapat “bersarang” di dalam sistem lain yang lebih besar,
- sistem dapat tumpang tindih dengan sistem lain,
- sistem dibatasi dalam ruang dan waktu,
- sistem menerima input (masukan) dari pemasok (supplier), dan mengirimkan output ke pelanggan (customer) atau ke lingkungan yang lebih luas,
- sistem terdiri dari proses yang mengubah input menjadi output,
- sistem bekerja otonom dalam memenuhi tujuannya. Contoh: mobil bukan sistem. Tetapi sebuah mobil dengan sopir adalah sebuah sistem.
Pendekatan berpikir sistem (systems thinking) menggabungkan beberapa prinsip:
- Interdependensi elemen-elemen (obyek-obyek), elemen-elemen yang independen bukan merupakan suatu sistem;
- Menggunakan pendekatan holistik secara menyeluruh;
- Memiliki tujuan di mana interaksi sistemik harus menghasilkan satu atau beberapa tujuan akhir;
- Memiliki input dan output serta proses transformasi, di mana untuk sistem tertutup proses input akan ditrasformasikan menjadi output tanpa berinteraksi dengan lingkungan, sedangkan dalam sistem terbuka selalu berinteraksi dengan lingkungan;
- Memiliki entropi di mana gangguan dan keacakan selalu hadir dalam sistem apapun;
- Memiliki peraturan yang memerlukan metode umpan-balik untuk keberlanjutan operasional dari sistem;
- Memiliki hirarki, di mana setiap sistem selalu memiliki subsistem yang lebih kecil.
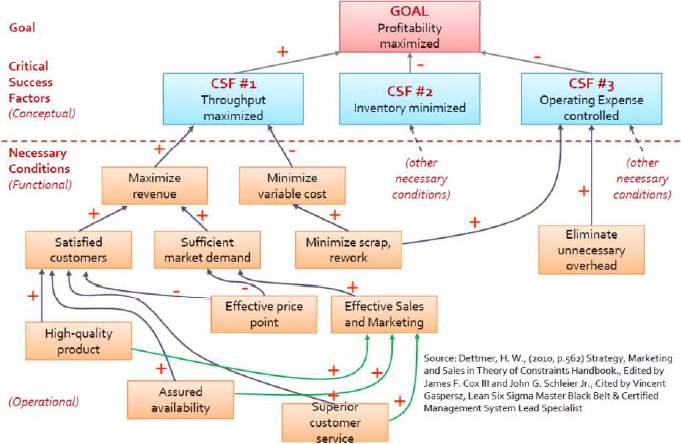
Bagan 4 terlampir menunjukkan contoh systems thinking dalam strategi pemasaran untuk meningkatkan profitabilitas perusahaan berdasarkan pendekatan theory of constraints (TOC).
Aplikasi Systems Thinking dalam Dunia Nyata
Cara berpikir system (systems thinking) apabila diterapkan dalam dunia nyata HARUS mengikuti tiga tahap berikut:
- Memahami Sistem (Understanding System)
- Memetakan Sistem (Mapping System)
- Mengambil Tindakan Dalam Sistem (Taking Action in System)
Karena perbaikan kinerja SISTEM akan tergantung pada EFEKTIVITAS perbaikan proses-proses di dalam sistem, maka apabila kita telah memahami system (apa saja), kita HARUS memetakan system itu melalui pemetaan proses-proses yang ada dalam system menggunakan strategi perbaikan proses seperti ditunjukkan dalam Bagan 5 terlampir.
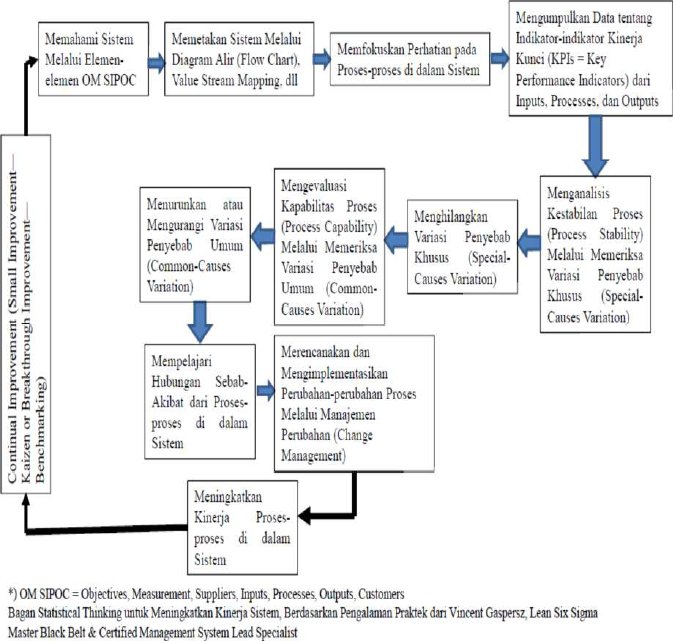
Perhatikan dalam Bagan 5 terlampir, di mana peranan statistical thinking menjadi sangat penting, karena kita harus memahami apa yang dimaksud dengan “Special Causes of Variation”, di mana apabila terdapat special causes of variation di dalam proses, maka dapat dipastikan bahwa proses-proses di dalam sistem itu TIDAK akan STABIL (instability). Demikian pula kita HARUS memahami apa itu “Common Causes of Variation”, di mana apabila terdapat “Common Causes of Variation” maka dapat dipastikan bahwa proses-proses di dalam sistem tidak akan memiliki kemampuan (incapability) untuk menghasilkan output sesuai target yang diharapkan.
Penjelasan tentang “Special Causes of Variation” dan “Common Causes of Variation” dapat dikemukakan sebagai berikut:
Variasi adalah ketidakseragaman dalam sistem (apa saja) sehingga menimbulkan perbedaan dalam kualitas pada output (barang dan/atau jasa) yang dihasilkan. Pada dasarnya dikenal ada dua sumber atau penyebab timbulnya variasi, yang diklasifikasikan sebagai berikut:
- Variasi Penyebab-Khusus (Special-Causes Variation) adalah kejadian-kejadian di luar sistem yang mempengaruhi variasi dalam sistem. Penyebab khusus dapat bersumber dari faktor-faktor: manusia, peralatan, material, lingkungan, metode kerja, dll. Penyebab khusus ini mengambil pola-pola nonacak (nonrandom patterns) sehingga dapat diidentifikasi/ditemukan, sebab mereka tidak selalu aktif dalam proses tetapi memiliki pengaruh yang lebih kuat pada proses sehingga menimbulkan variasi. Dalam konteks pengendalian proses statistikal (statistical process control) menggunakan peta-peta kendali atau kontrol (control charts), jenis variasi ini sering ditandai dengan titik-titik pengamatan yang melewati atau keluar dari batas-batas pengendalian yang didefinisikan (defined control limits).
- Variasi Penyebab-Umum (Common-Causes Variation) adalah faktor-faktor di dalam sistem atau yang melekat pada proses yang menyebabkan timbulnya variasi dalam sistem beserta hasil-hasilnya. Penyebab umum sering disebut juga sebagai penyebab acak (random causes) atau penyebab sistem (system causes). Oleh karena penyebab umum ini selalu melekat pada sistem, maka untuk menghilangkannya harus menelusuri pada elemen-elemen dalam sistem itu dan hanya pihak manajemen sistem yang dapat memperbaikinya, karena pihak manajemen sistem yang mengendalikan sistem itu. Dalam konteks pengendalian proses statistikal (statistical process control) menggunakan peta-peta kendali atau kontrol (control charts), jenis variasi ini sering ditandai dengan titik-titik pengamatan yang berada dalam batas-batas pengendalian yang didefinisikan (defined control limits).
Suatu proses di mana hanya mempunyai variasi penyebab-umum (common-causes variation) yang mempengaruhi output atau “outcomes” adalah merupakan proses yang stabil karena penyebab sistem yang mempengaruhi variasi biasanya relatif stabil sepanjang waktu. Variasi penyebab-umum dapat diperkirakan dalam batas-batas pengendalian yang ditetapkan secara statistikal. Sedangkan apabila variasi penyebab-khusus terjadi dalam proses, maka akan menyebabkan proses itu menjadi tidak stabil. Upaya-upaya menghilangkan variasi penyebab-khusus akan membawa proses ke dalam pengendalian statistikal.
Pemahaman dan pengendalian variasi merupakan inti dari Statistical Thinking. Dr. W. Edwards Deming, seorang ahli statistika dan total quality management menyatakan bahwa sasaran dari pengendalian kualitas adalah mengurangi variasi sebanyak mungkin. Pendekatannya adalah menstandardisasikan proses melalui setiap orang menggunakan prosedur kerja, material, dan peralatan yang sama. Di samping itu pihak manajemen sistem harus mempelajari proses, mencari sumber-sumber potensial dari variasi, mengumpulkan data, dan kemudian menghilangkan variasi penyebab-khusus itu. Sedangkan variasi penyebab-umum merupakan tindakan konkrit berikut sebagai bukti komitmen dari manajemen sistem untuk perbaikan proses terus-menerus (continual process improvement) setelah variasi penyebab-khusus dihilangkan dari proses itu.
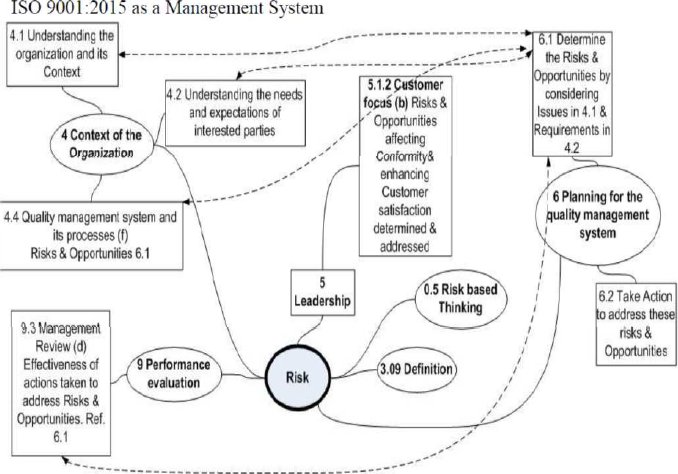
Jika kita memahami Statistical Thinking, maka akan sangat mudah mengembangkan systems thinking, sehingga berbagai hubungan keterkaitan antar-elemen dalam dunia nyata sangat mudah dipahami. Sebagai misal kita dengan mudah melihat keterkaitan antar-klausul dari sistem manajemen kualitas ISO 9001:2015 seperti ditunjukkan dalam Bagan 6 terlampir.
Demikian inti dari aplikasi statistical thinking maupun systems thinking dalam dunia nyata yaitu untuk menemukan dan mengidentifikasi variasi penyebab khusus dan variasi penyebab umum agar mampu secara terus-menerus menurunkan atau mengurangi variasi dari proses-proses di dalam sistem, sehingga kinerja sistem dapat ditingkatkan terus-menerus. Berdasarkan hal ini, maka ilmu STATISTIKA adalah benar disebut sebagai ilmu tentang variasi (berdasarkan esensi penggunaan statistical thinking dalam dunia nyata) BUKAN hanya kumpulan rumus-rumus statistika TANPA memahami statistical thinking and systems thinking.
Salam SUCCESS.
Statistical Thinking to Improve Business System Performance
By: Vincent Gaspersz, Lean Six Sigma Master Black Belt Certified Management System Lead Specialist and Auditor
- American Production and Inventory Control Society (www.apics.org) Certified in Production and Inventory Management (CPIM), Certified Fellow in Production and Inventory Management (CFPIM) and Certified Supply Chain Professional (CSCP);
- American Society for Quality (www.asq.org) Certified Manager of Quality/Organizational Excellence (CMQ/OE), Certified Quality Engineer (CQE), Certified Quality Auditor (CQA), Certified Quality Improvement Associate (CQIA), and Certified Six Sigma Black Belt;
- International Quality Federation (www.iqf.org) Certified Six Sigma Master Black Belt (CSSMBB);
- Registration Accreditation Board (www.exemplarglobal.org) Certified Management System Auditor (CMSA), Certified Management System Practitioneer (CMSP), Certified Management System Specialist (CMSS), and Certified Management System Lead Specialist (CMSLS).
The Division of Statistics from The American Society for Quality (ASQ Statistics Division) puts forward three basic philosophical main principles of Statistical Thinking, namely:
- All work happens in interconnected processes within the system.
- Variations are always present in all processes within the system
- The key to SUCCESS is to understand the process and to reduce variations in all processes in order to achieve the desired TARGET value within the system.
The three basic principles of Statistical Thinking above can be shown through the attached Chart 1 above.
In the real world, the Statistical Thinking practice towards a target of variation reduction will increase customer satisfaction and this can be demonstrated through Taguchi’s loss function that provides concept that supports the idea that the variation reduction towards the target will increase customer value and reduce costs. The Taguchi’s loss function has the quadratic form of L(x) = k(x – m)^2, where x is the unit deviating from the target value, m is the target value, and k is the loss coefficient, as shown in the attached Chart 2 below.

Using the three basic principles of Statistical Thinking above, Lynn D. Torbeck (2011, p.94-95)) in the Journal of Pharmaceutical Technology developed Statistical Thinking into the following 10 basic concepts:
- Work takes place within the processes and sub-processes that are interconnected with each other, known by name as the SIPOC model (Suppliers-Inputs-Processes-Outputs-Customers).
- Note: internal customers are persons or components/departments/divisions within the organization that receive output from the process, while external customers are people or components/departments/divisions outside the organization that receive output from the process. The output of a process can take the form of the final result or the intermediate result that still needs to be processed further.
- Each process can be mapped using flow charts or other tools, studied systematically, understood, and improved. However, performing optimization at each step of the process separately can result in the process to be not optimum globally, in the sense that sub-optimum can occur.
- Work is done by groups of people who have differences in educational backgrounds, skills, expertise, needs, and expectations.
- The output of each process varies as common result of special or systematic causes of variation and common or random causes of variation. These causes of variations can be found, studied, and understood.
Note: team work that does not work effectively is a source of variation within the system (common or random causes of variation).
- Causal relationship is the foundation of science. This causal relationship can be found, studied, quantified, and understood.
- Variability is the enemy of good organizational management practice, validation, quality, productivity, efficiency, and profits. Variability can be measured, learned, and understood.
- Statistics is the science of variation.
- Variability in the process can be reduced BUT can not be eliminated. We need to adopt a philosophy towards TARGET and work for CONSISTENCY.
- Each organization achieves SUCCESS through continuous improvement involving team work to reduce variation and bring the process into stability statistically (statistical stability).
By linking STATISTICS with real-world problems using 10 CONCEPTS as the development of Statistical Thinking, then Statistical Thinking can achieve integration from management, real-world problem solutions, and statistical techniques. The linkage between Statistical Thinking and Statistical Methods (Statistical Tools) can be shown in Exhibit 3.

What is Systems Thinking?
Before discussing systems thinking and its applications in the real world, it is necessary to understand some of the terminology about systems thinking that has been accepted by professional societies internationally.
- System Thinking is a discipline to see things as a whole (holistically), not partially, which aims to study patterns of change (dynamics) rather than statics, as well as to understand the interrelationships between many elements (patterns of relationships) in a defined system. In the real world everything that is interconnected will form the system, for example: education system, farm system, government system, social system, business system, etc.
- Systematic Thinking is a way of thinking using certain methodology (methods). For example, a Lean Six Sigma Master Black Belt/Black Belt/ Yellow Belt will use DMAIC (Define, Measure, Analyze, Improve, Control) or PDCA (Plan, Do, Check, Act) methodology when improving processes within system. Or he/she will use DMADV (Define, Measure, Analyze, Design, Verify) or Design Thinking methodology when designing processes in a new system or an existing system.
- Systemic Thinking is a way of thinking using analytical combination (based on analysis) and synthesis.
Note: analysis and synthesis are parts of higher order thinking based on Bloom’s taxonomy.
Some ways to think and define systems are related to the following criteria:
- system has goal (objective)
- system consists of elements,
- all elements of the system must be related (directly or indirectly),
- system has limit,
- system limit is the decision made by a person or group of people,
- system can “nest” within other larger systems,
- system can overlap with other systems,
- system is restricted in time and space,
- system receives input from the supplier, and sends the output to the customer or to the wider environment,
- system consists of process that converts the input into output,
- system works autonomously in fulfilling its purpose. Example: a car is not a system; but a car with a driver is a system.
Systems thinking approach combines several principles:
- Interdependence of elements (objects); independent elements are not a system;
- Using holistic approach thoroughly;
- Having the objective in which systemic interactions must result in one or more final objectives;
- Having input and output as well as transformation process, where for closed system, the input process will be transformed into output without interacting with the environment, while in open system, the input process always interacts with environment;
- Having entropy where distractions and randomness are always present in any system;
- Have rule that requires feedback methods for operational sustainability of the system;
- Having hierarchy, where every system always has a smaller subsystem.
Chart 4 below shows an example of systems thinking in marketing strategy to improve the profitability of firm based on the theory of constraints (TOC) approach.

Systems Thinking Application in the Real World
Systems thinking, when applied in the real world, MUST follow the following three steps:
- Understanding System
- Mapping System
- Taking Action in System
Because the performance improvement of the SYSTEM will depend on the EFFECTIVENESS of process improvements within the system, then if we have understood the system (any system), we MUST map that system through mapping existing processes in the system using the process improvement strategy as shown in Chart 5 attached below.

Note in Chart 5 above, where the role of statistical thinking becomes very important, because we must understand what is meant by “Special Causes of Variation”, where if there are special causes of variation in the process, it can be confirmed that the processes in that system will NOT be STABLE (instability). Similarly, we MUST understand what “Common Causes of Variation” is, where if there are common causes of variation, then it can be confirmed that processes in the system will not have the capability to produce the desired output target.
The explanation of “Special Causes of Variation” and “Common Causes of Variation” can be put forward as follows:
Variation is the nonuniformity in the system (any system) so it creates differences in the quality of the generated output (goods and/or services). Basically there are two sources or causes of variations, which are classified as follows:
- Special-Causes Variation are events outside the system that affect variations in the system. Special causes can come from factors of: people, equipment, material, environment, working method, etc. These special causes take nonrandom patterns so they can be identified/found, because they are not always active in the process, but have a stronger influence on the process leading to variation. In the context of statistical process control using control maps or charts, this type of variation is often characterized by the observation points that pass through or are out of the defined control limits.
- Common-Causes Variation are the factors in the system or that are inherent in the process that cause variations in the system and its results to occur. Common causes are often referred to as random causes or system causes. Since these common causes are always attached to the system, then in order to eliminate them, it is necessary to trace them to the elements in that system and only the system management side who can fix them, because the system management controls the system. In the context of statistical process control using control maps or charts, this type of variation is often characterized by the observation points that are within the defined control limits.
A process, in which only has common-causes variation that affect output or “outcomes”, is a stable process because the causes of the system that are affecting variation are usually relatively stable over time. Common-causes variation can be estimated within the statistically determined control limits. Meanwhile, when special-causes variation occur in the process, it will cause that process to become unstable. Efforts to eliminate the special-causes variation will bring the process into statistical control.
Understanding and controlling variations is the core of Statistical Thinking. Dr. W. Edwards Deming, an expert of statistics and total quality management stated that the goal of quality control is to reduce as much variations as possible. The approach is to standardize process through having everyone to use the same work procedures, materials, and equipment. In addition to that, the system management side must study the processes, look for potential sources of variations, collect data, and then eliminate those special-cause variations. The common-causes variation is the next concrete action as the evidence of commitment of the system management side for continual process improvement after the special-causes variation has been removed from the process.
If we understand Statistical Thinking, then it will be very easy to develop systems thinking, so that various relationships between elements in the real world are very easy to understand. For example we can easily see the inter-clause linkages of the ISO 9001:2015 quality management system as shown in Chart 6 below.

Thus, the core of the application of statistical thinking and systems thinking in the real world is to find and identify the special-causes and common-causes variations in order to be able to continuously decrease or reduce the variations of processes in the system, so that system performance can be improved continuously .Based on this, then the science of STATISTICS is proper to be referred to as the science of variations (based on the essence of the use of statistical thinking in the real world), NOT just a collection of statistical formulas WITHOUT understanding statistical thinking and systems thinking.
Best Regards for SUCCESS.
